
Optimizing Lab Safety and Sustainability
Co-written By: Aircuity’s Center of Excellence and Paul O’Malley founder of Paul O’Malley Associates, LLC, a Boston-based strategy consulting firm
Environmental Health & Safety (EH&S) has historically relied on a prescriptive air changes per hour (ACH) approach to provide safe lab and research environments. Unfortunately, this required high constant air flow rates that were very expensive and resulted in high carbon emissions. While providing the illusion of safety, this approach provided no visibility into the actual events happening in these spaces, the effective working of the ventilation systems, or the actual ACH being delivered.
As owners and operators have continued to pursue efficiency gains in pursuit of net zero, in these most energy-intensive and carbon-emitting building types, they have implemented lower and lower fixed ACH rates. This “ACH creep” has raised scrutiny and concerns regarding questions like, “How low can you go?” and “What is a safe ACH rate?” over the last decade. Fortunately, a much better alternative to prescriptive ACH rates has been gaining traction—one that reduces cost and carbon emissions while improving safety by dynamically controlling ACH rates based on accurate real-time measurement of air quality. This paper aims to demystify prescriptive vs. manual approaches to lab safety via a data-driven, actively managed lab EH&S program. Here are some highlights of insights and actual data from more than a decade of operational and safety results across multiple organizations.
Historical Lab Management Practices

Historically, laboratories were set up to have 10 to 12 air changes per hour (ACH) to err on the side of maximum safety. While this may have given the illusion of a safe lab, safety events were still a risk, leaving EH&S personnel primarily in a reactive response mode of operation. Although 10 to 12 ACH is better than lower rates at effectively ventilating a space, it comes at an extremely high environmental and operating cost. One of the most cited studies by Yale University in the late 2000s showed that 8 ACH was the ideal rate for maximum efficacy needed to clear a room with little gain in performance above 12 ACH. This study led clients to push ACH rates lower and lower to save money, with some even going to 6 ACH. All the while, EH&S still lacked the data required to verify indoor air quality (IAQ) and to gain insights regarding lab safety practices. This approach, while operationally easy to implement, did not save money and still posed a safety risk. The reality is that most unsafe exposures cannot be seen instantaneously without the use of calibrated and accurate testing devices, which won’t be deployed without a compelling reason—i.e., a spill or call of an “event” from a lab occupant.
Theoretical studies regarding what ACH rate is safe were mostly done via controlled lab experiments and/or computational fluid dynamic “CFD” modeling. In the end, this multi-variable and complex equation was hard to study over longer periods and real-world safety efficacy was still to be determined. What resulted was equivalent to clients “picking an ACH number”—depending on the situation, this approach may have delivered too little or too much airflow. These situations can last an hour, a day, many days, weeks, or sometimes even months.
Shortcomings of Prescriptive ACH Approaches
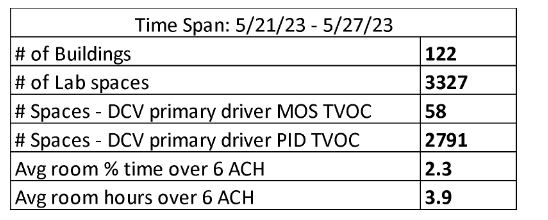
Hindsight is, however, 20/20, as the saying goes. While the prescriptive approach seemed easier to implement, it typically led to one of two practices: pushing to save more energy or sticking with what was seen as the conservatively safe ACH. Both approaches are like a broken clock—they can be corrected twice a day. However, data shows that there are few occasions where the exact right ACH was being delivered. The result was that significant energy was wasted and carbon emissions were emitted when the air was otherwise clean, or insufficient air was provided to address the various events occurring in research environments. An analysis of the data from a sampling of clients’ lab buildings shows us that on average rooms only need to run at a higher ACH to address events 2.3 percent of the time.
One of the most important and common misunderstandings is exactly what the term “events” means. These are most frequently thought of as “spills,” which of course do happen, but this is just one of many possible episodic events that occur. “Events” are unsafe lab environments—which can be fume hood-related but can also occur in the macro lab environment. The ACH rates referred to are those associated with the macro environment—i.e., the room. These unsafe lab conditions can be broken out into three types, as described very well in the CCAC Guidelines1.
The first is systemic events, which are unsafe lab airflows resulting from the design and/or maintenance of the HVAC system. Next are operational events, which arise from ineffective standard operating procedures, training, and/or use of equipment. The third type of event is episodic. By definition, they cannot be predicted. In many cases, episodic events can cause the highest risk level because they can persist for long periods between random or planned inspections, which can be scheduled weekly, monthly, or even annually.
Historical Lab Management Practices and Lab Banding
Strategies to mitigate risk are to develop more effective training methods and to conduct better and more frequent inspections of lab HVAC systems and manual testing by EH&S teams. Think of this as the “brute force approach.” The idea is that if a lab establishes strict rules, conducts more training, and ensures that all rules are being followed—and if nothing changes—a lab can achieve best-in-class safety. This approach identifies rooms with certain risk levels and then prescribes ACH levels for that room, the use of only certain chemicals and in specified quantities, etc. It also assumes that all experiments are done in containment hoods and that those hoods are properly working. This, of course, assumes that the lab operates under ideal conditions and incurs no episodic events. While lab banding had been around even before lowering ACH rates came into vogue, and it is supported by ASHRAE and some EH&S consulting firms, it is still a “static” approach that relies on system and operational episodes being quickly diagnosed and mitigated. Most importantly, it lacks any detection of episodic events. While banding is a logical approach for designing and qualifying room usage—in other words, to set a baseline for expected operating conditions—the lack of “real-time” feedback means that, by itself, banding is not an effective means of monitoring events and capturing insights to prevent future events and/or to react in real-time to provide safer operating conditions. To manage a banding program, organizations rely on human oversight reviews, which only capture a few hours of the 8,736 annual hours of operation. In perspective, that could be 0.2 percent of the total operating time.
So, while “banding” is a needed first step that can yield incremental improvements and create a necessary operating baseline, it relies on everyone operating as trained, and all systems working as intended with no episodic or unplanned events. We know this is not reality in any real-world operating condition. In fact, banding is challenged by human behaviors, constantly changing experiments and chemical usage, lack of “real-time feedback,” and frequent changeover in research operators. This has left many clients “chasing their tails,” trying to implement this static banding approach. One very well-known institution abandoned this approach after less than two years.
None of this is to say clients shouldn’t have a room safety rating and continue to train researchers on safe lab practices/protocols for specific spaces. This is absolutely part of best practice lab safety programs, but there is now strong evidence that using a demand-based control approach coupled with banding is the best approach for measuring and dynamically managing ventilation rates to optimize safety, energy savings, and decarbonization
DBC and A Data-Driven Approach
Demand-based control (DBC) for research spaces has been around for over 15 years and is a proven and reliable concept for safer and more efficient lab operations. With thousands of successful implementations worldwide, validated by third parties, a DBC platform has a significant impact on safer lab operations.
The University of California, Irvine has deployed DBC across nearly 1,500 research spaces. UCI cites that DBC, coupled with its SmartLabs program², has resulted in UCI having a significantly better safety record when compared to all other institutions in the UC school system. Moving from a reactive approach of responding when something bad happens or when someone complains of a smell or stale airflow, to a proactive system of continuous, real-time safety improvement, is not possible without real-time measurement and intelligent insights regarding all research spaces. This is often referred to as the “data layer.” By no means is DBC a silver bullet, but it is this information layer and feedback loop that enables EH&S to proactively address the various system, operational, and episodic events that happen across all UC research institutions.
Equally important, DBC gives EH&S, facilities, and occupants confidence that their space will have more air, where and when it’s needed, versus the use of a prescriptive approach. In most cases when an event occurs in the room, ACH is driven to double the baseline amount—i.e., from 8 to 16 ACH or 6 to 12 ACH. This layer of safety is critically important and one that is not possible with a banding-only approach. Researchers and owner-operators always need to balance the cost of safety measures with the relative improvement those measures produce.
It’s also important to recognize that most clients have lower nighttime or unoccupied lab airflow rates to generate additional savings. It is critical to note that occupancy sensors should not be used to adjust lab ACH rates, as they can cause real risk for someone entering a room that had been unoccupied, but they can help set higher temperature dead bands during day settings and provide valuable data regarding lab occupancy. In contrast, a DBC system operates 24/7 and increases ACH both in daytime and nighttime operating conditions based on a room’s air quality, ensuring safety at all times.
While economic payback as a primary benefit is not a focus of this article, the great news is that these systems often provide outstanding operational and sustainability impacts, resulting in less than three simple paybacks and massive carbon mitigation. The safety improvements discussed far more than pay for themselves operationally, which makes it easy for upper management to support a DBC program.

Let’s dive deeper into this feedback loop and this new toolset for EH&S. Citing two of the most commonly used analytics of the DBC data platform, the figure below shows a ranking of the worst-performing rooms as a percentage of time over the baseline ACH. This report allows end users to quickly focus on rooms where the most persistent events are occurring and offers insight as to what is causing them. Users can quickly see if elevated TVOC levels as measured by a PID (Photo Ionization Detector) sensor, are causing this space’s ACH to go higher, or if the airflow could have been driven higher by thermal load requirements rather than the DBC system. This is the responsibility of the energy and facility management teams rather than EH&S.
It’s clear that these tools can provide quick paybacks in energy efficiency, time, and operational efficiency. Where they really excel is adding a layer of safety that didn’t previously exist and wouldn’t exist with a banding-only, prescriptive ACH approach.
EH&S teams may be fearful that the DBC program may create more work for them. However, end users who work closely with the data analytics platform may find the platform useful because it offers insight into issues before they become big problems, or it shows that the lab’s system is working as it should and so intervention is not needed.
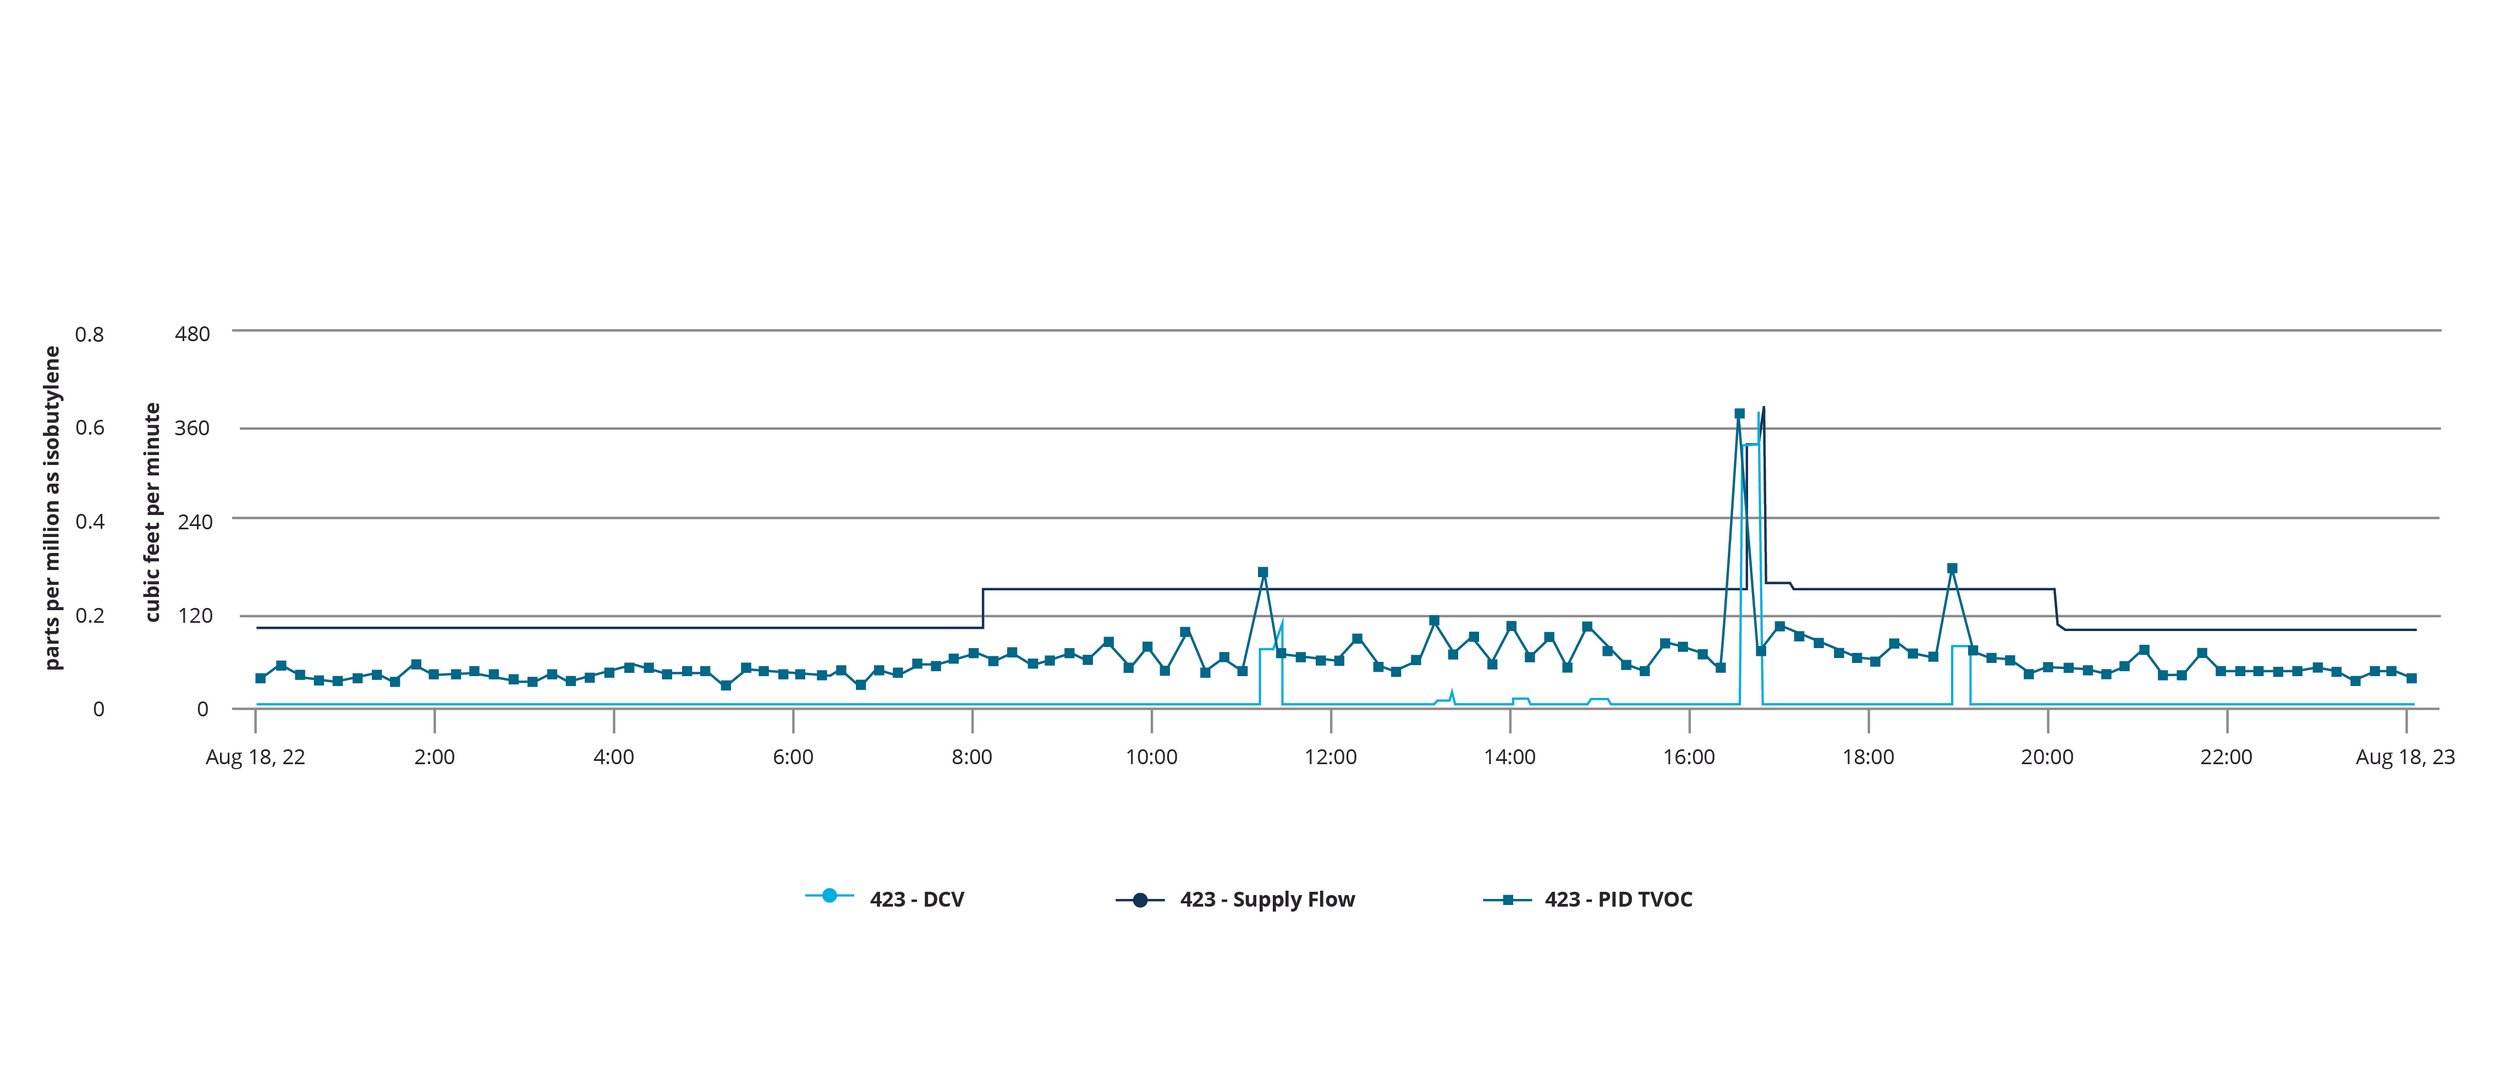
Events happen in labs often and randomly by room, floor, and building. When working properly, airflow ramps up to clean (purge) the room and then ramps back down, as shown in the graph.
The immediate concern of EH&S is when events last longer than a customizable and pre-set duration period, or when they peak at very high levels (also customizable). EH&S can then define the criticality of information to focus on those situations which present real and immediate risk, versus those that are lower risk and should be investigated only if they persist.
Case Studies

Numerous case studies demonstrate the effectiveness of DBC and data-driven EH&S approaches. One example of DBC and a data-driven approach took place in a lab at a major research university when a researcher was improperly venting his experiment using a mass spectrometer. The researcher was sticking the exhaust of the mass spectrometer into the local snorkel exhaust, then unknowingly pinched it off with the blast gate. This created elevated TVOC levels in the lab (detected by the DBC) which increased ventilation rates as a response. Most importantly, upon seeing the notification from the system, EH&S was able to proactively find and correct this researcher’s behavior. In this case, it was determined that this intervention undoubtedly protected the user from real harm – potentially short-term and most likely long-term exposure harm. The university’s feedback was, “This approach is an improvement to our EH&S practices while providing the co-benefit of energy and sustainability improvements” – citing the EH&S insight as the primary benefit!
At Michigan State University David Erickson, Senior Industrial Hygienist, was notified by a research team of a possible CO₂ leak as new bottles were quickly emptied. “Within minutes, the system reported a room with an elevated level of CO₂ and increased amount of outside air flowing into the room,” says Erickson, “I contacted the building manager, and we identified the source in no time.” This saved an incredible amount of operations time along with providing higher ACH until the source of the leak was detected and corrected.
In the third case study, the EH&S department at a major pharmaceutical company conducts regular of their spaces using the room purge report. This report shows the worst-performing rooms based on the amount of time at higher than baseline ACH. Through these reviews, they have diagnosed and corrected several system and operational events.

More Data = Improved Safety, Decarbonization, and Energy Savings Benefits
Over several years and across hundreds of organizations globally, DBC control linked to an information management system has proven to be a more sustainable and safer way to operate and maintain research spaces. When reviewing the costs and benefits of deploying a system, DBC checks the two most critical boxes. First, it increases safety while supporting continuous learning and the adoption of safety best practices. It drastically improves the ability of EH&S teams to proactively identify and correct the various types of events vs. reacting once events are discovered. Second, while some in the new construction industry might say; “It costs too much,” this has been proven to be untrue. A program with paybacks of less than three years while bringing a long list of co-benefits is not a cost, it is an attractive investment, a reality that third parties have verified over a 15-year period. When the total value of improved safety + operational savings + carbon reduction + co-benefits is added up, this is often an infinite rate of return. Thus this approach should become ubiquitous in the built environment as it is undeniably a better economic and safety choice.